 |
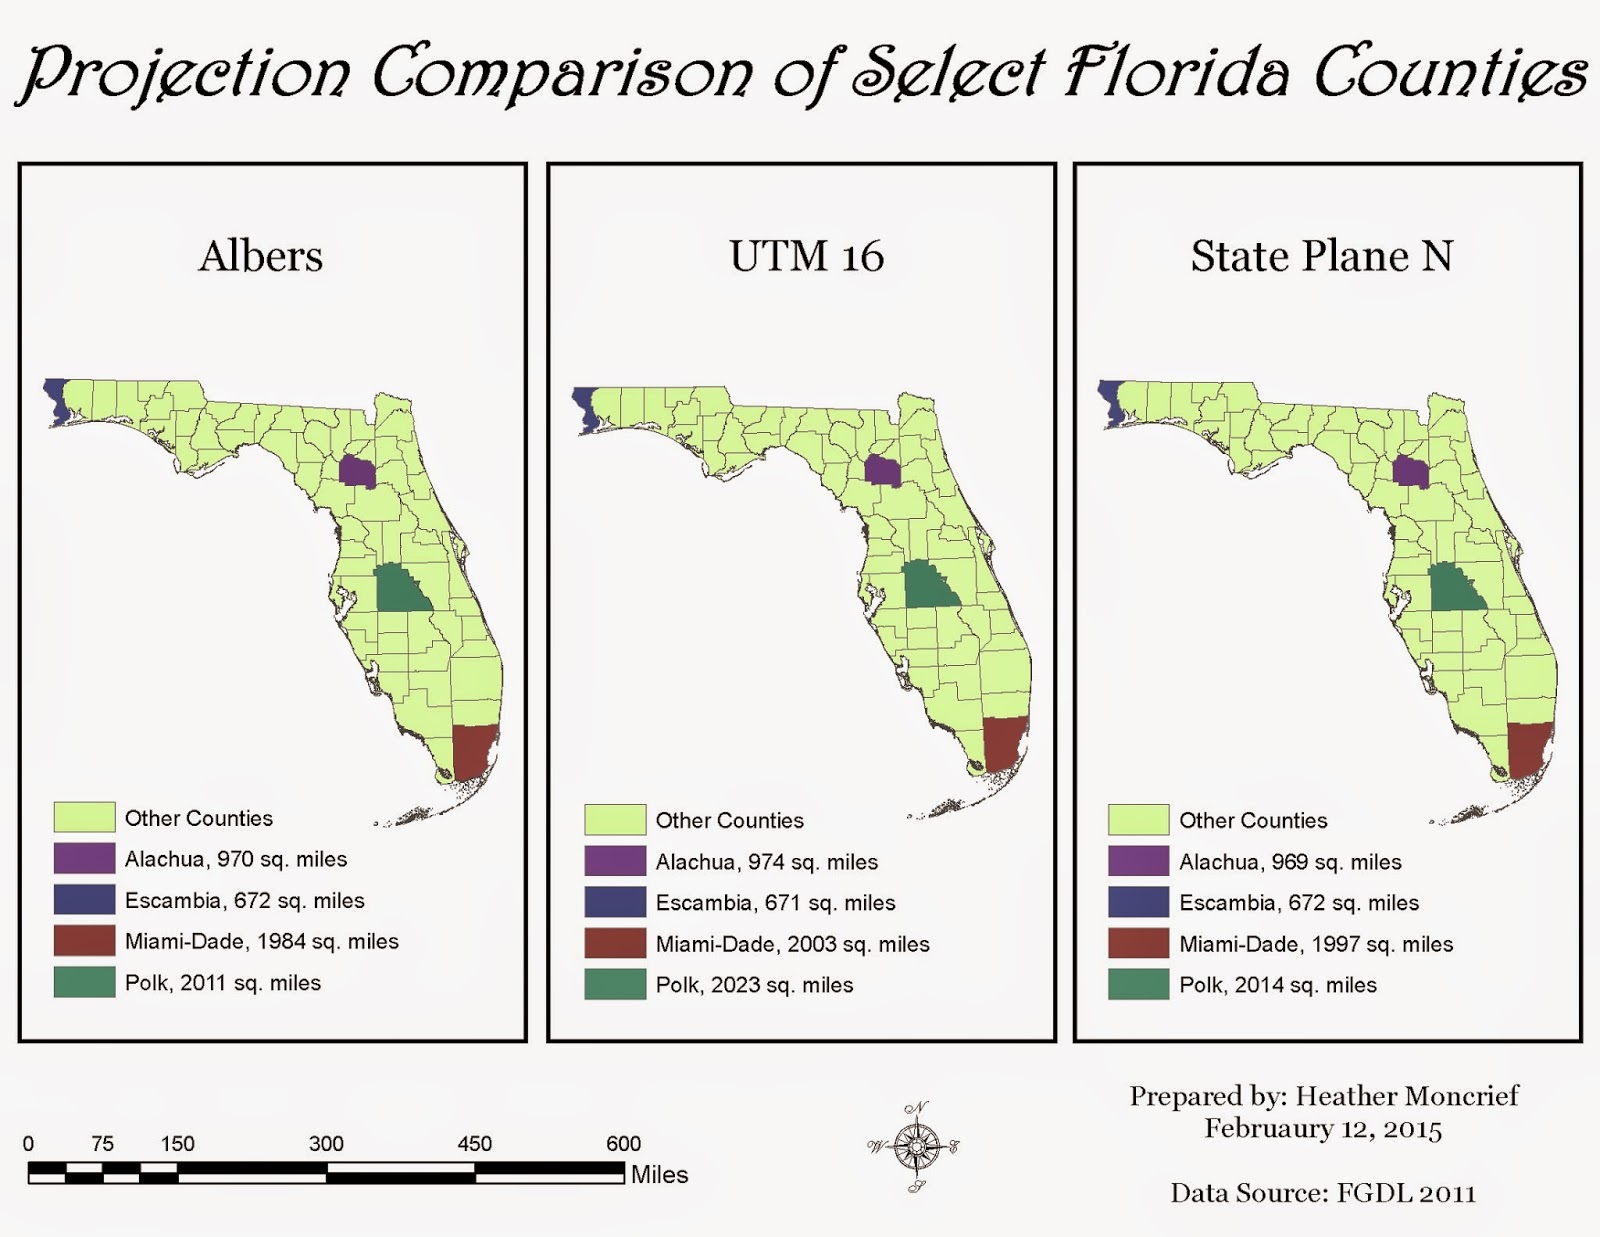
| Comparison of three projected coordinate systems, Albers, UTM 16, and State Plane N projected onto the state of Florida. Alachua, Escambia, Miami-Dade and Polk Counties are highlighted as examples. Source: FGDL 2011 |
This week we learned about projections and how they affect the map-making process. I enjoyed making these maps, especially seeing the difference in the projected coordinate systems. This is honestly something I had never considered before. I think it is definitely beneficial that we set up the maps this way, with three on one image, it allows you to be able to see the slight differences in the shape of the state. Showing the area of the counties across all of the maps is very helpful as well, since it shows the slight differences in size among the projections.
I set my maps up very similar to the example provided, because I thought it was set up well and wanted to see if I could teach myself a couple of things while doing the lab. This did add a little bit of time to my lab time since every time you make major changes to your legend, you have to reset the color ramp. I think I set those colors 4 times!
No comments:
Post a Comment